How Far Have Disney World's Monorails Traveled Since 1971?
We couldn't find a lifetime mileage total from Disney for the Walt Disney World monorails, so we did the math from 55 years of fleet history.

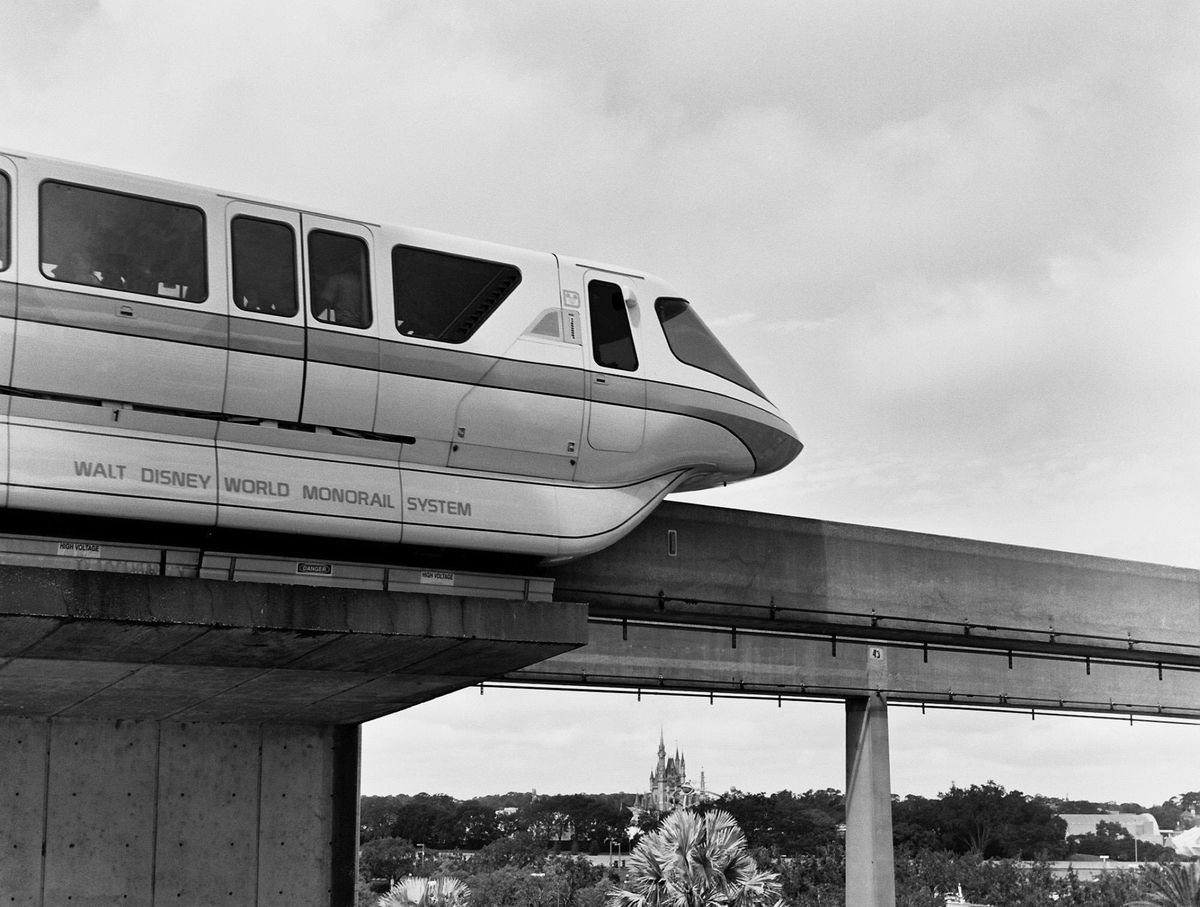
Quick Answer: We couldn't find a lifetime mileage total from Disney for the Walt Disney World monorails, so we built one line by line from published operating figures. Our estimate is about 37 million miles since October 1, 1971, somewhere between 34 million and 41 million. That's roughly 72 to 85 round trips to the Moon.
Picture one monorail train on the Resort loop on an ordinary Tuesday. It stops at the Transportation and Ticket Center, the Polynesian, the Grand Floridian, Magic Kingdom and the Contemporary, then does it all again, from before the park opens until an hour after it closes. Now multiply that by a fleet of 12 trains and 55 years. That's the number we went looking for.
The only published total stops in 1989
The best numbers we found are old ones. The Monorail Society says the original Mark IV fleet had covered nearly ten million miles by the time Mark VI trains started arriving in 1989, at about 67,500 miles per train each year. WDWNT puts each Mark IV at almost a million miles over an 18 to 20 year career. Neither covers what came next, so we built our own model of all 55 years and used those figures to test it.
How we did the math
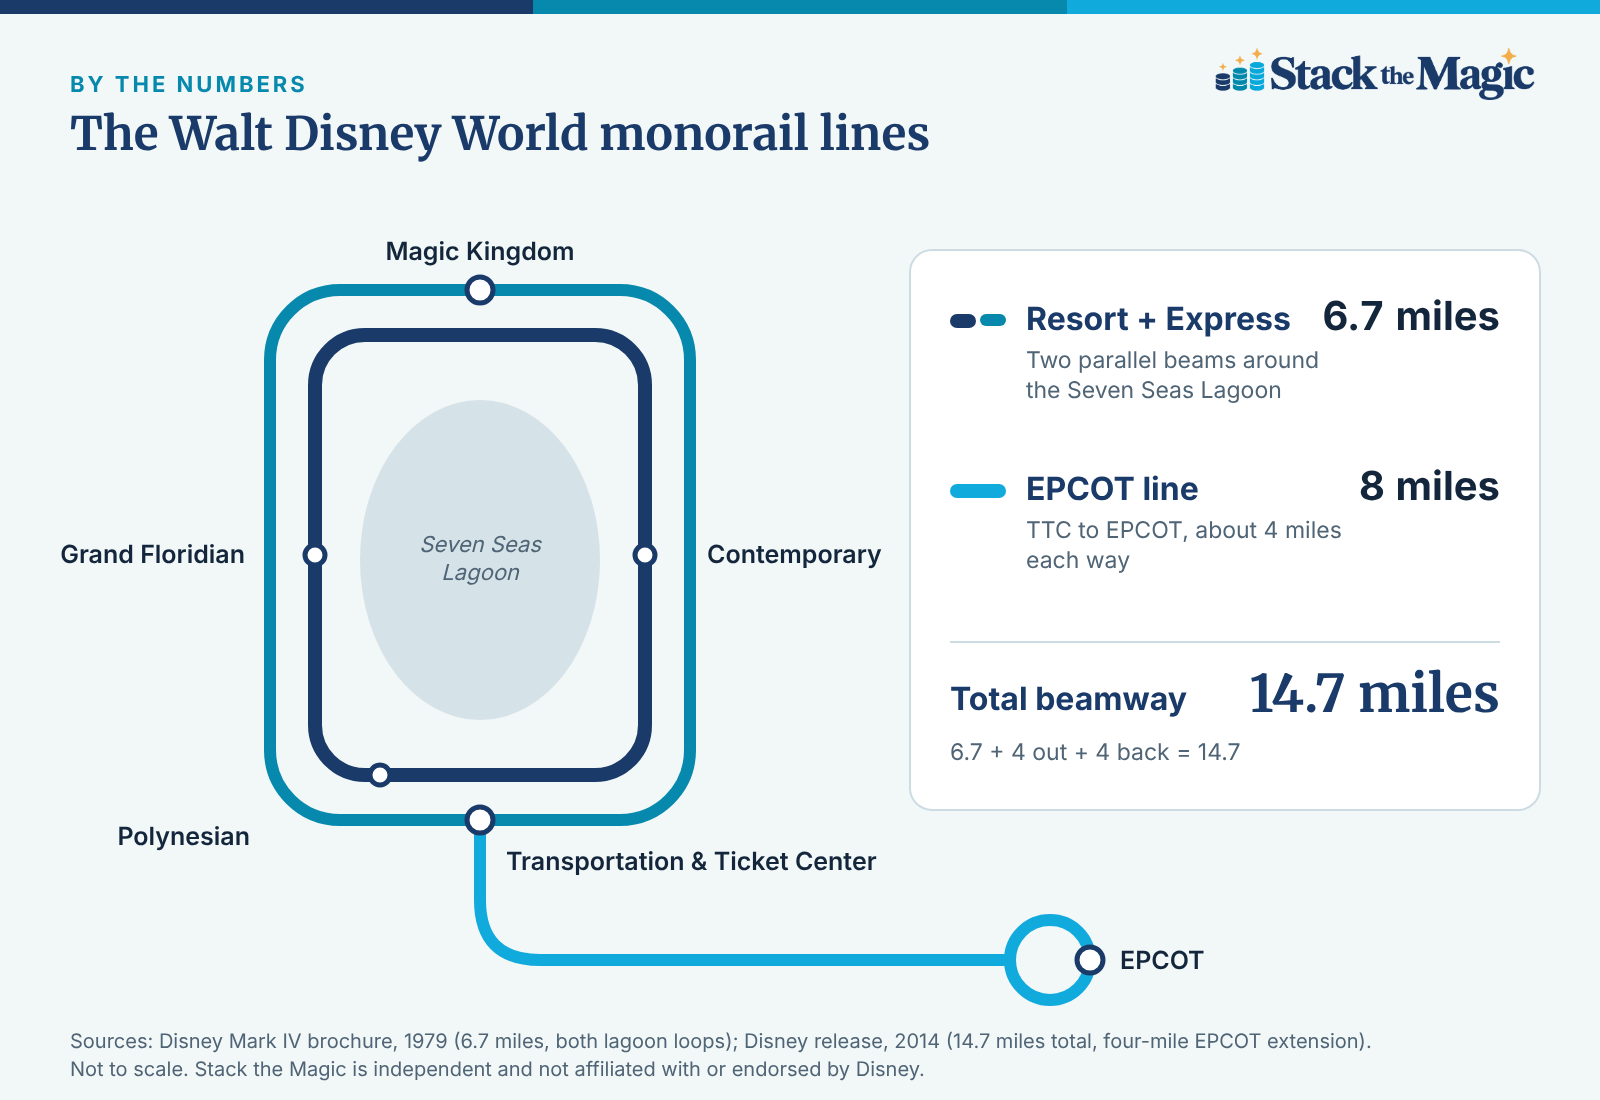
Our anchor is a 1979 Disney brochure for the Mark IV monorail, scanned by Progress City, U.S.A., with a full year of real operating data for the two Magic Kingdom loops: 6,011 hours of service, 40,558 train-hours and 519,370 train-miles. That's about 6.75 trains running at any moment, averaging just under 13 mph once station stops are counted.
For each line, a day's miles are trains running, times hours, times average speed. Here's what went in:
| Line | Length | Avg. speed with stops | Trains running | Hours a day |
|---|---|---|---|---|
| Resort + Express, to 1982 | 6.7 miles, both loops | 12.8 mph | 6.75 | 16.5 |
| Resort + Express, since 1982 | 6.7 miles, both loops | 12.8 mph | 6.75 | 14.5 to 16.5* |
| EPCOT, since June 1982 | 7.3 to 8 miles round trip* | 13 to 18 mph* | 3* | 14.5* |
Figures from Disney's 1979 Mark IV brochure and Disney's monorail page; starred figures are our assumptions. Last Checked: November 12, 2026.
The assumptions, one line each:
- Park hours: Magic Kingdom open 13 to 15 hours and EPCOT 12, plus Disney's half hour before opening and one hour (Magic Kingdom) or two (EPCOT) after closing.
- EPCOT trains: three at a time, the number on the EPCOT beam at the end of the night in the NTSB's 2009 crash report.
- EPCOT speed: a bit faster than the Magic Kingdom loops, since it has two stations rather than four or five.
- EPCOT length: The Monorail Society's 14.7 miles of beam today, minus the 1979 brochure's 6.7 miles and its 0.7-mile spur to the shop.
- Early years: the fleet ran a little under 1979's pace while it was still arriving, so our low end uses the brochure's "over 4 million miles" in its first eight years.
- Gaps: everything stopped from mid-March to July 11, 2020, EPCOT's line stayed shut until July 18, 2021, and our low end takes out the trains lost in the July 2009 crash until Monorail Peach restored 12 in October 2011.
- Hurricane days and refurbishments are too small to move the total.
Run 10.7 years of Magic Kingdom-only service and 44.4 years with all three lines, take out the gaps, and you get about 34 million to 41 million miles.
Then we checked it against the old numbers:
- Total by mid-1989: 10.0 million to 11.2 million miles in our model, against The Monorail Society's "nearly ten million." Our low end matches.
- Miles per train in 1989: 55,000 to 67,000 in our model, against its "around 67,500." Our high end matches.
- One Mark IV's career to 1989: 0.9 million to 1.0 million miles in our model, against WDWNT's "almost a million." Both ends fit.
Those two Monorail Society figures don't quite agree with each other: ten million miles by 1989 implies fewer miles a year than 67,500 per train does. We didn't force the model to pick one. Our range runs between them, and our headline sits in the middle.
What 37 million miles looks like
- 1,400 to 1,650 laps of Earth at the equator
- 72 to 85 round trips to the Moon
- 37% to 44% of the way to the Sun
- 2,500 to 3,000 years of driving for a typical American driver
Our estimates, using NASA's figures for Earth's diameter, the Moon's average distance (238,855 miles) and the Sun's (93 million miles), and the Federal Highway Administration's average of 13,476 miles a year per driver. Last Checked: November 12, 2026.
Our favorite is the last one. Start driving the family minivan the day Magic Kingdom opened, keep going at an average American's pace, and you'd still need nearly 2,500 more years to catch the monorails.
The odometer is still running
At today's hours, every year adds another 660,000 to 810,000 miles, well over one more round trip to the Moon. Not bad for a fleet whose youngest regular train dates to 2011.
For the trains, the three lines and the 2009 crash in full, see our complete guide to the Walt Disney World monorail. And if you'd rather steer one yourself, Monorail Bounce is free in our Game Room.